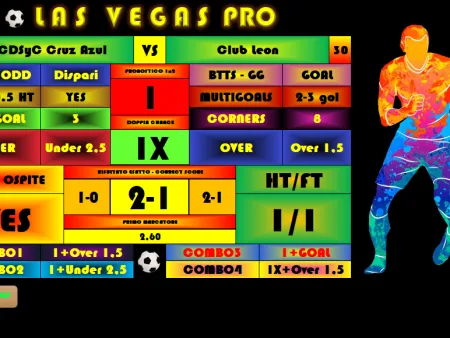
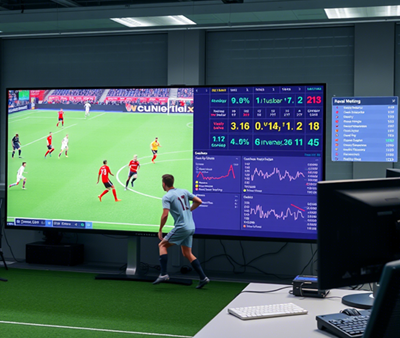
Our goal regarding the match, the statistics of which are presented above, is to be able to predict the outcomes of football matches as accurately as possible in terms of additional bets (1X2) and goal bets (over/under). We will structure our strategy into three stages:
1. Data-Driven Analysis (Dynamic Performance Index — DINPI)
At this stage, we will create a Dynamic Performance Index (DINPI) for each team. This index takes into account the overall form of the team, variables occurring during the match, and the compatibility with the opponent. It uses the following components:
A. Overall Form and Statistics
- General statistics and performance from the last 6 matches (win, draw, loss).
- Average performance metrics (attacking strength and defensive weaknesses).
- Success rates in home and away matches (considering the home-field advantage).
B. Variables During the Match
- Injury/suspension status of key players.
- Rotation in previous matches (fatigue factor).
- Weather and field conditions (which may affect the likelihood of scoring goals).
C. Competitor Compatibility Analysis
- Team results against opponents playing in a similar style.
- In other words, how effective is a team that plays on the counter-attack against opponents with a high defensive line?
Starting Point: Each component is assigned a score from 0 to 10, and the team’s Dynamic Performance Index is calculated as follows:
DINPI = (Overall Form x 0.4) + (Match Variables x 0.3) + (Opponent Compatibility x 0.3)2. Strategic Modeling (Goal Potential Matrix — GPM)
Let’s develop a Goal Potential Matrix (GPM) to determine the expected number of goals in a match. This model predicts the number of goals scored by comparing the attacking and defensive strengths of the teams.
A. Attacking and Defensive Strength
- Metrics for goals scored (xG) and conceded (xGA) per game.
- Differences in xG between home and away matches.
B. Goal Range
The Poisson distribution is used to estimate the number of goals for each team: For example, if a team has an average goal rate of 1.8, the Poisson probabilities of scoring 0, 1, 2, or 3 goals are calculated. The opposing team’s defensive strength slightly adjusts this ratio.
C. Total Goals Forecast
The goal potential of both teams is summed up. For example: Home (1.8) + Away (1.2) ≈ 3 total goals (base prediction for over/under).
100% match bonus based on first deposit of £/$/€20+. Additional bonuses.
3. Decision-Making Stage: Bet Selection (Balancing Probability and Risk)
In light of the predicted outcomes, betting options for additional bets and goal bets are determined as follows:
A. For Additional Bets (1X2)
- DINPI Difference: If the difference in DINPI points between the two teams exceeds 3 points, bet on the favorite’s win. Specify the percentage, e.g., the probability of winning an away match is 60 percent.
- Risk of Draw: If the DINPI difference is 0-2, the probability of a draw is high.
B. For Goal Bets
- GPM Above Limit: If the estimated total number of goals is greater than 2.5 (e.g., 3-3.5), consider betting on over. Specify the percentage, e.g., the upper value ends at 65 percent.
- Fast-Starting Teams: Bet on over 1.5 in the first half (especially for fast-starting teams).
- Score Prediction: For example, predict a 1-0 score in the first half and a 2-0 score at full time. Similarly, you can look for matches like Hon Linh — 1-3 goals, ideally :))
This structured approach ensures a balanced combination of data analysis, strategic modeling, and risk management to optimize betting decisions.


